About ImmuNet
The ImmuNet web interface is developed to provide immunology researchers with an
easy-to-use resource for exploring the collection of immune-related
functional
relationship networks. The 15 ImmuNet networks provide a series of pathway-relevant gene-gene
relationship predictions ‒ distilled using data from over 38,000 genome-scale experiments.
Below are descriptions & examples of the exciting features found in ImmuNet.

The Functional Relationship Network
The functional networks presented by ImmuNet are highly interactive and configurable. Network views can be controlled by filtering edges by confidence or filtering nodes by connectivity.
Supporting genomic data for functional relationship predictions are readily accessible by hovering over or clicking on any edge in the network. The top ten datasets contributing to the prediction are displayed, and specific evidence from the datasets can be investigated in greater detail.
For example, querying ImmuNet with the complement component 3a receptor 1 (C3AR1) might unveil molecular entities and immune processes not previously known to be associated with the complement system
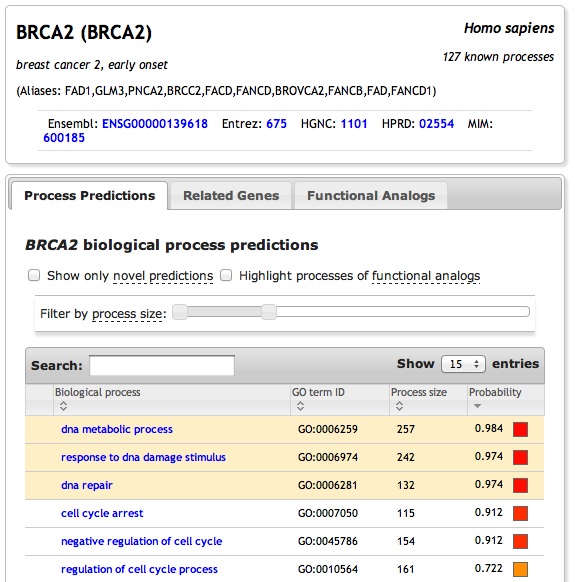
Exploring the Network Components
After a query, the table on the left provides the researcher with two primary methods to explore the resulting functional network:
Tab: Functional Relationships - use this to explore the top predicted relationships to the queried gene(s). Genes highlighted in yellow are already known to be associated with the queried gene(s).
Tab: Biological process enrichment - use this to identify biological processes that are enriched in the current network view. (NOTE: changing filter properties dynamically refreshes this tab).
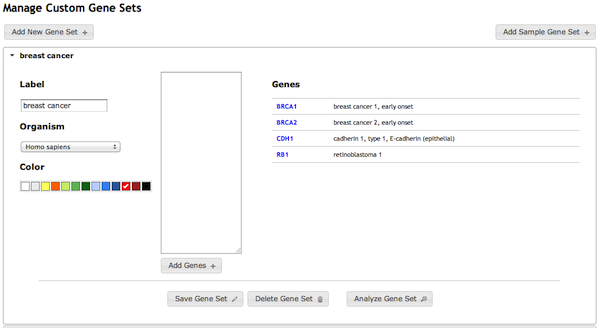
Submit custom gene sets
ImmuNet’s users can create custom gene sets for their analysis (for example, a list of genes identified as over-expressed in a microarray experiment) and submit them for analysis. In the analysis, a graphical search of the selected immune network is performed on the gene set to retrieve predicted functional neighbors (those likely to participate in the same pathway). ImmuNet presents these as highly-interactive networks: users can adjust the layout by moving genes, query the evidence supporting a functional relationship, and modify graphical options to customize the display. Importantly, as users adjust network parameters, an enrichment analysis updates in real-time as the network specificity is narrowed or broadened (effectively contracting or expanding the user’s gene set).
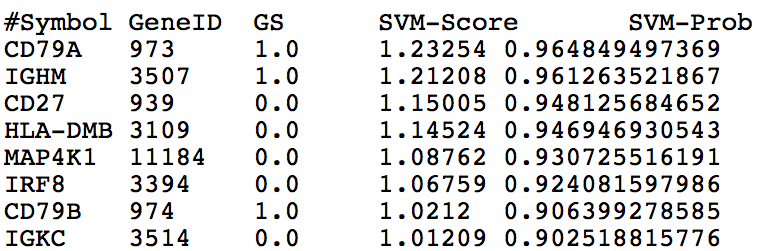
Generate Disease Predictions
The networks of ImmuNet can be used as features in an SVM classifier to generate gene predictions for a selected set of genes. The resulting gene predictions and their probabiliites are provided via email. Below is an explanation of the generated columns:
Symbol: HGNC gene symbol
GeneID: Entrez gene identifier
GS: Presence and use of gene in the gold standard
- 1.0 Positive example (known association with disease)
- 0.0 Not in the GS (Novel Prediction)
- -1.0 Randomly selected negative
SVM-Score: SVM distance value (larger values indicate higher confidence)
SVM-Prob: Inferred SVM probabilities of a gene's relationship to the disease